Overfitting in Trading Strategies: When a Backtest Looks Too Good

You're looking at a backtest that seems like it never had a losing streak. The equity curve climbs almost without interruption, the metrics look strong, and yet one question remains: did this strategy find a real edge, or was it just tweaked until it matched the past? That question sits behind the term overfitting. By the end of this article you'll know what overfitting and curve fitting mean, why the number of optimized parameters changes the risk, and what tools StrategyQuant X offers against it: Cross Checks, multimarket analysis, Monte Carlo simulation, an optional Overfit Risk Score plugin, and analysis after optimization. You'll also see clearly what these checks can tell you and what they can't.
What overfitting and curve fitting mean
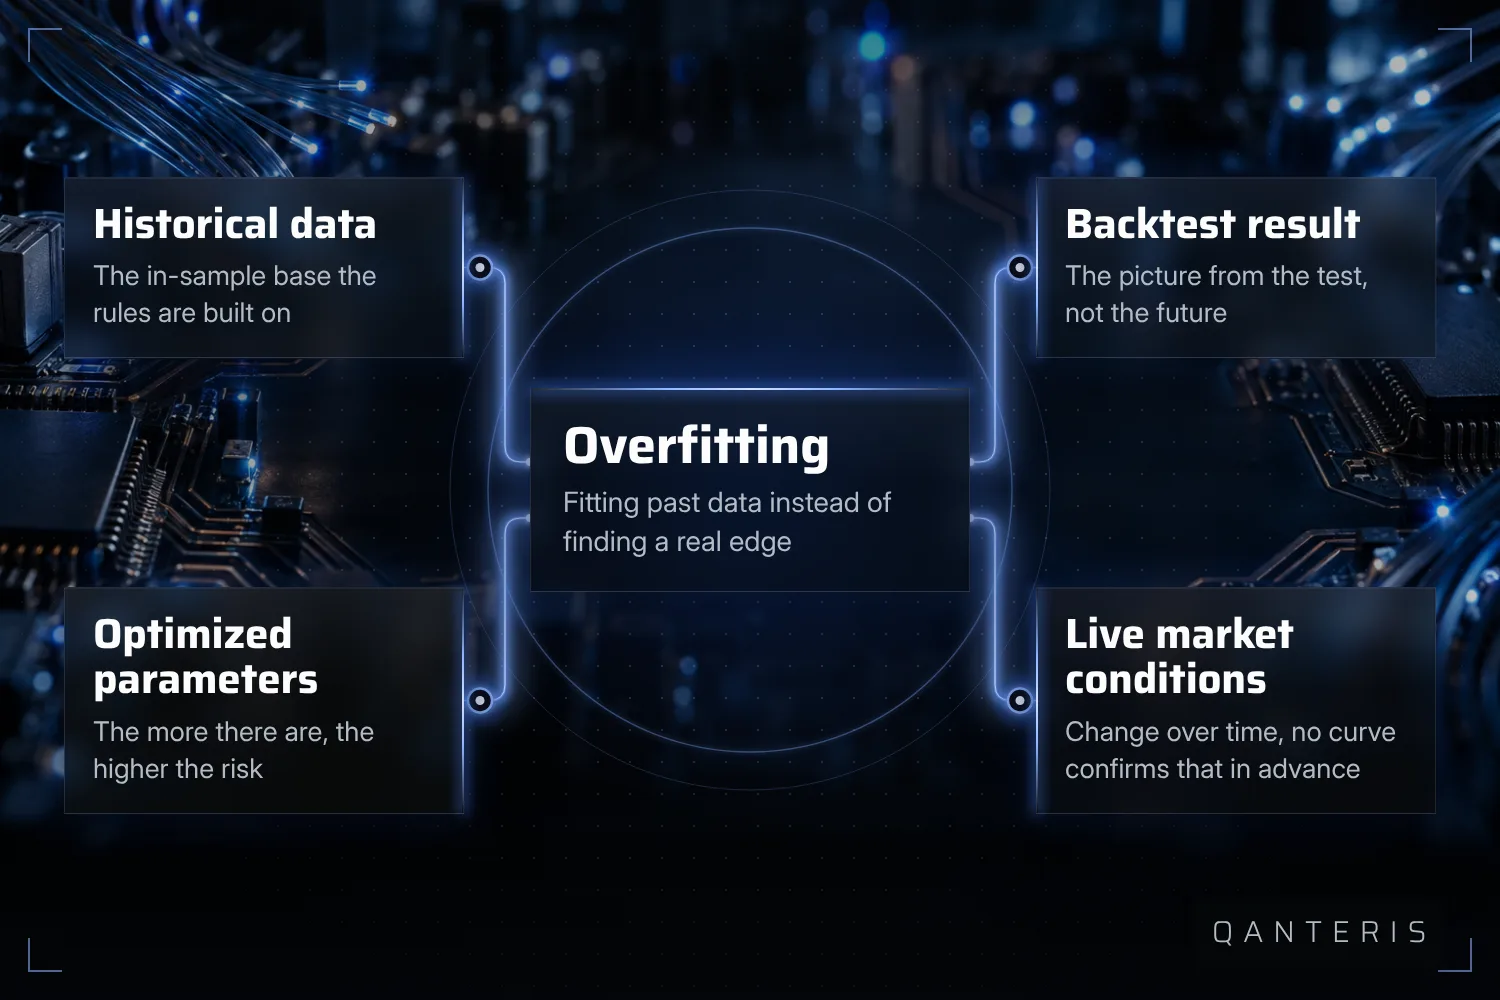
Overfitting means fitting a strategy to the exact historical data it was built on. StrategyQuant's documentation describes it as the biggest danger with strategies built using generation methods in the style of machine learning. That doesn't mean hand built strategies are automatically safe from it, the source makes no claim either way, the warning is specifically about this build method.
Curve fitting is closely related and describes a strategy being shaped to the past until it looks good in the backtest, without any real edge necessarily behind it. In the community you'll often hear both terms used together. They describe two sides of the same problem: fitting what happened instead of what tends to repeat.
Why more optimized parameters raise the risk
Every parameter you open up in an optimization run gives the algorithm one more way to adapt to the quirks of that specific price data. The more of these are open at once, the easier it is for the optimization to find a combination that happens to match the past, without any solid logic behind it. The documentation states that fewer optimizable parameters tend to make a strategy more robust. That doesn't mean a strategy with few parameters is automatically free of overfitting, there's no evidence for that. Fewer dials reduce the opportunity for overfitting, they don't rule it out.
What shows up when you look at out-of-sample data
A clear drop in performance often only becomes visible when a strategy meets new, unseen data, in other words the out-of-sample test. The documentation describes this drop as strategy deterioration and names two possible causes: overfitting to the in-sample data, or changed market conditions the strategy can't adapt to. A weaker out-of-sample result is a signal, not proof. You can't automatically conclude that overfitting caused it, the market may simply have changed in the meantime. For you as a trader, that means a disappointing out-of-sample result is a reason to look closer, not an automatic verdict. And even a strategy that passes this comparison has only been tested against past data. None of these checks tell you in advance how the strategy will behave under real, future market conditions.
StrategyQuant X offers several tools for this. The best way to think of them is as different angles on the same question, not as one tool that hands you a final verdict.
Cross Checks: the built-in robustness check
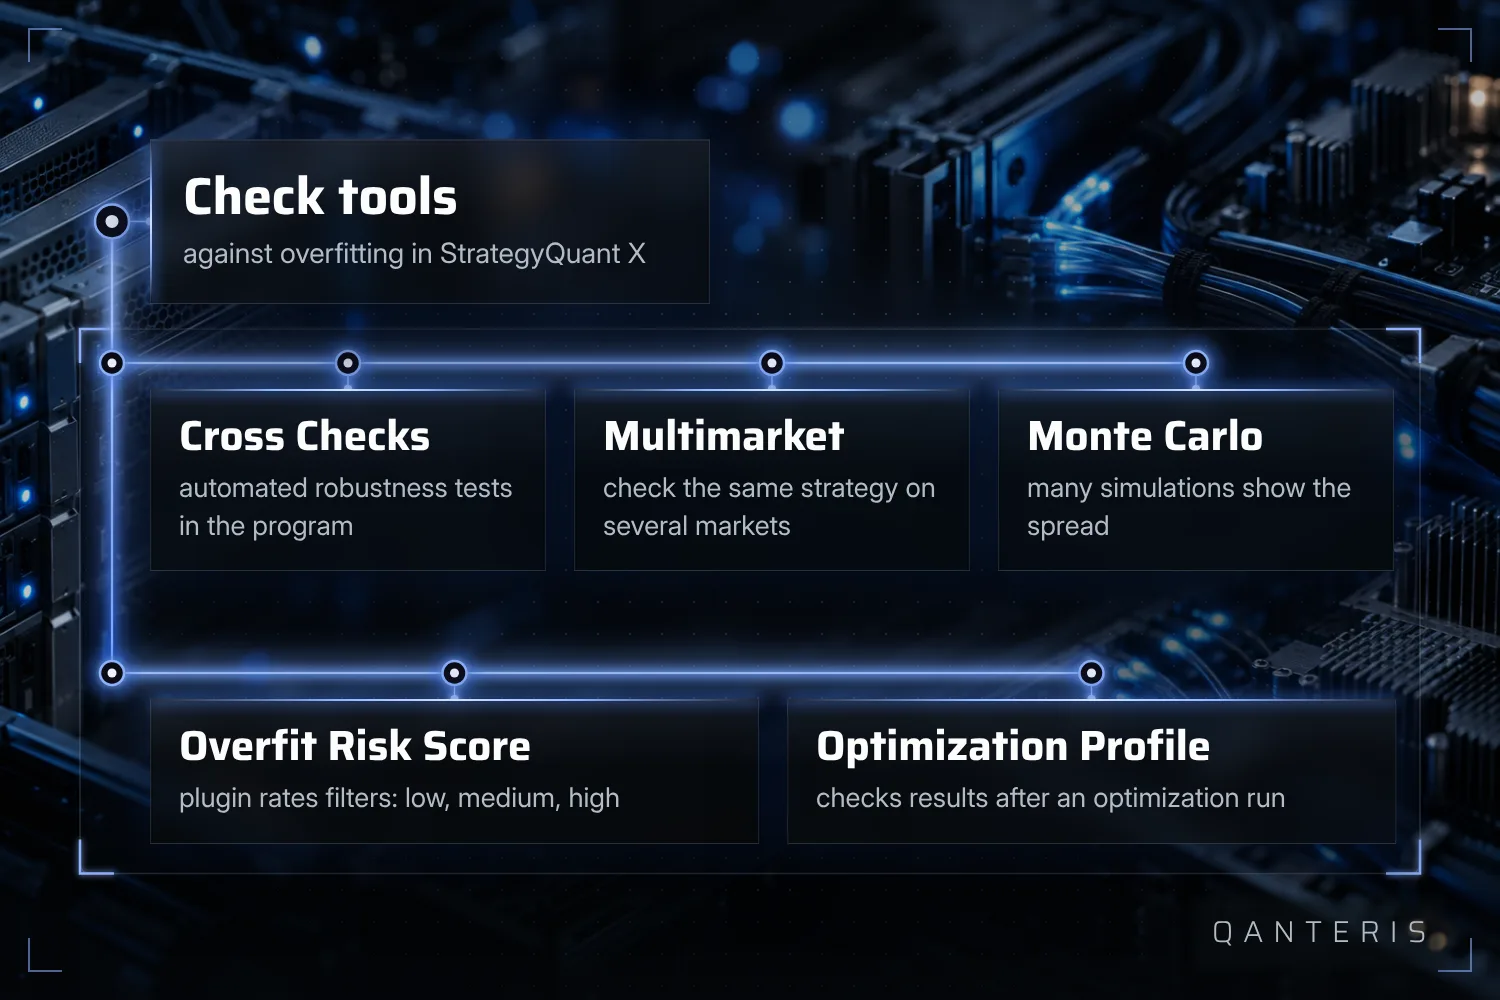
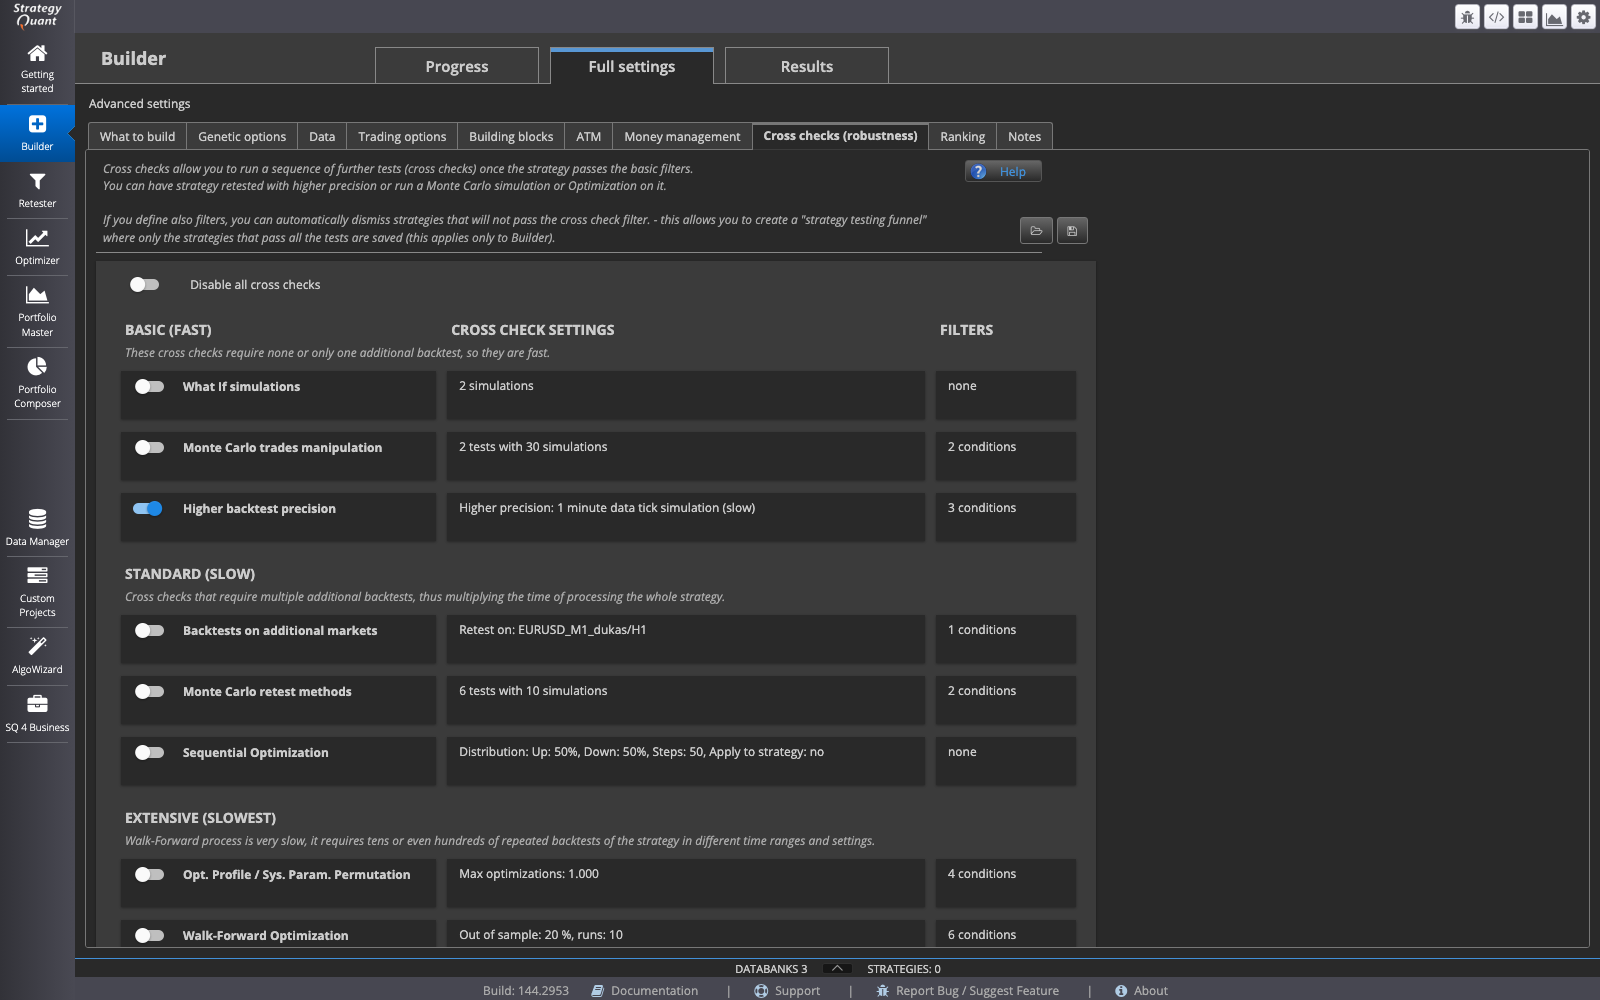
Cross Checks are described in the documentation as a fixed part of StrategyQuant X. The robustness tests and overfitting safeguards are meant to help make sure a strategy has a real edge and isn't just looking good. That's the vendor's description of the tool's purpose, not an independent measurement on a specific strategy. The tool shows you something, it doesn't decide the question for you.
Multiple markets as an additional check
Another check described in the documentation is looking at whether a generated strategy also works on several markets, not only on the one it was built for. This is one of the described ways to rule out overfitting during strategy analysis in StrategyQuant X. To do this, you set up additional markets and follow the described multimarket workflow with median snippets in the Databank. Here too: a passed multimarket check doesn't prove a strategy is free of overfitting. It's an additional check under different conditions, nothing more.
Monte Carlo simulation: many runs, a look at the spread
Monte Carlo analysis in StrategyQuant works by repeating the same simulation many times with small random changes. The documentation notes that the more repetitions you run, the more reliable the resulting statistical distribution becomes. Importantly, this method works with past, simulated trading data. It is not a prediction of the strategy's future results. It shows how much the past result depends on small chance variations.
The Overfit Risk Score for filters
A described plugin can calculate an Overfit Risk Score whenever filters are applied, with levels of low, medium and high. It's based on the number of active filters, the share of trades filtered out, and whether so called hindsight filters are used, meaning filters shaped after the fact to fit already known results. This tool comes from an author on the StrategyQuant team writing under a company address, so it counts as an official contribution, not as a documented core feature of the software. Even a low score doesn't prove a strategy contains no overfitting, it only rates the filter logic you've just applied.
Build methods: random generation, data mining and the classic approach
The documentation describes random generation as a build mode said to be less prone to overfitting, because the strategy isn't further optimized or refined after it's built. That's stated in the section on the advantages of this mode. It doesn't mean random generation rules out overfitting, only that a certain step is missing, the step where it can otherwise arise.
The documentation also distinguishes between a classic, hand built approach without data mining, like building a strategy in AlgoWizard, and data mining, where a large number of rules are tested to find the strategy with the highest observed historical performance. This distinction is meant as a framework, not a step by step guide. The source doesn't say data mining automatically carries more overfitting risk than the classic build method, there's no evidence for that.
Analysis after optimization: Optimization Profile and Parameter Permutation
Optimization Profile and System Parameter Permutation both assume an optimization run has already been done. These methods then evaluate the results of all runs from that optimization. They don't replace the out-of-sample test, they come in afterward and show you how sensitive the result is to small changes in the parameters.
What these checks show, and what they don't
Cross Checks, multimarket analysis and Monte Carlo simulation together give a much fuller picture than a single backtest alone. Still, there's a limit none of these checks can remove: each of them works with past or simulated data. None of them can confirm in advance how a strategy will behave under real, future market conditions. A clean backtest, a passed Cross Check or a stable Monte Carlo distribution are signs that can support your judgment. None of them is proof of future results.
Next time you're looking at a flawless equity curve, it's worth asking how many parameters were optimized, whether the strategy works across several markets, and what the Monte Carlo distribution says about the spread. One answer alone is rarely enough, several angles together get you closer.
This article is for education only and is not investment advice. Past results, including backtests, do not guarantee future results. Trading financial instruments involves risk, and you can lose money.
This article is for education only and is not investment advice. Past results do not guarantee future results.
How do you do it? Share it in the community. Free, in your language.
Sign up free