Monte Carlo Simulation in Trading: What It Shows

You've built a trading strategy and tested it in a backtest. But how stable is that result if small things had gone differently, if trades had occurred in a different order, or if slippage had been a bit higher? This is exactly where the Monte Carlo simulation in trading comes in. It takes your already completed backtest and repeats it many times with small, random changes. From these many repetitions, a statistical estimate emerges of how risky and how profitable your strategy was under slightly altered conditions of the past. In this article you'll see what actually gets changed in such a run, which metrics come out of it, why the number of runs matters, and where the method reaches its limits.
What a Monte Carlo simulation in trading is
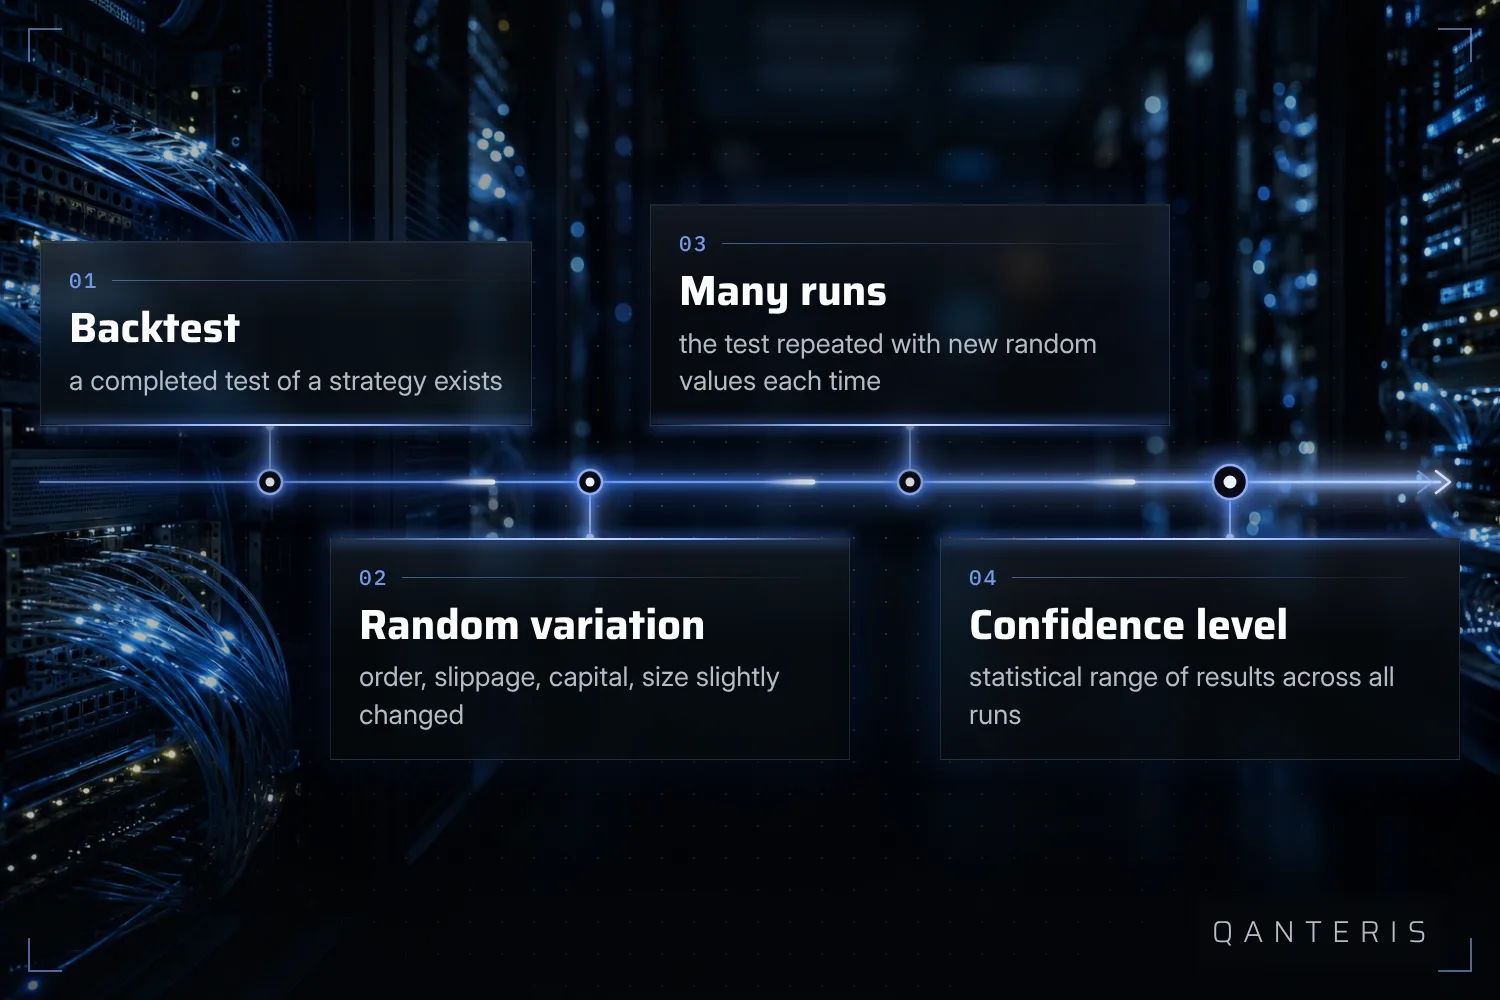
A Monte Carlo analysis is a method that repeats the simulation of a strategy many times with small, random changes. The goal is to statistically estimate the strategy's risk and profit-and-loss behavior. This always assumes an already completed backtest: the Monte Carlo analysis builds on that backtest, it doesn't replace it.
The principle can be described as a sequence. At the start is your strategy's finished backtest. From this backtest, a great many individual runs are generated, each with small random changes built in. At the end of these many runs is a statistical evaluation in the form of confidence levels, more on that in the section on metrics below.
What changes with each run
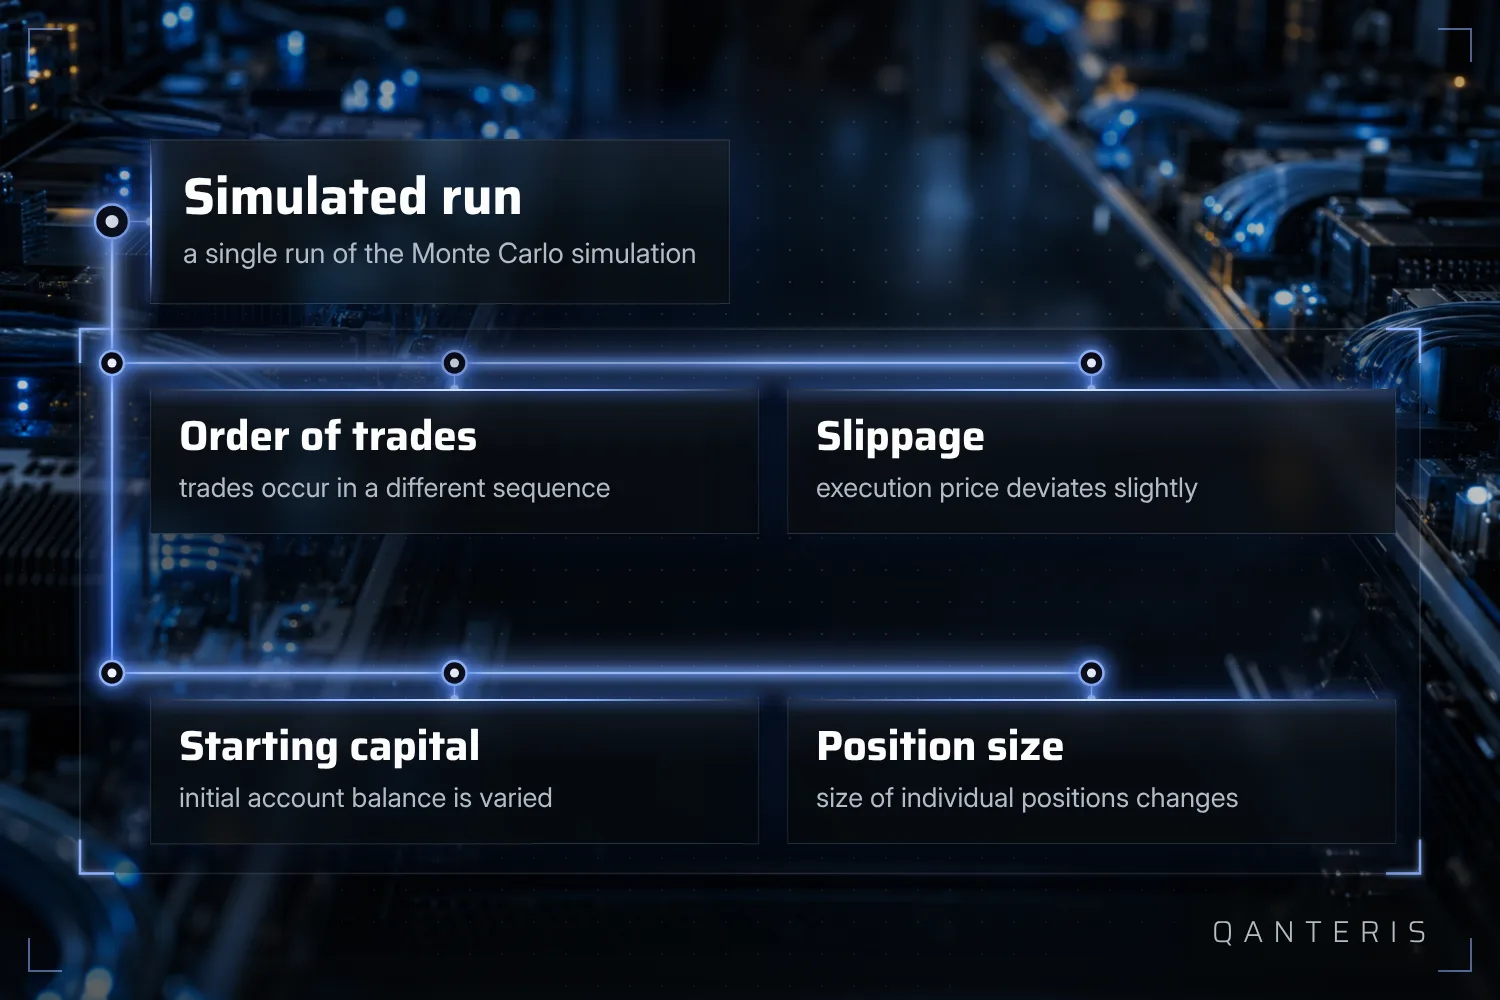
A Monte Carlo test simulates a large number of random scenarios to assess the performance of a trading strategy. Several factors are changed at the same time: the order in which trades occur, the slippage during execution, the starting capital, and the position size.
What matters here is what these scenarios are not. They are computational variations of your already existing historical data, not actual future market movements. The simulation shows you how sensitive your strategy was to such small shifts, but nothing more.
What metrics a Monte Carlo simulation delivers
A Monte Carlo simulation delivers results for predefined confidence levels. To do this, it calculates metrics across all simulated scenarios such as net profit, percentage net profit, and the ratio of return to drawdown. This always requires an already completed backtest as the basis of the simulation.
You should read these confidence levels as a statistical range based on variations of historical data. They don't guarantee any future return and aren't a prediction of what will happen in live trading.
How the number of simulations affects the estimate
The Monte Carlo analysis is meant to show how sensitive a strategy is to changes such as market cycles or the order of transactions. As a rule: the more simulation runs you carry out, the more reliable the resulting estimate tends to be.
How many runs make sense in a given case depends on the available computing time and on the number of simulations you set. There's no fixed number that's sufficient for every strategy and every situation alike. More runs cost more computing time, but the picture becomes more complete.
Example: number of simulations in Portfolio Composer
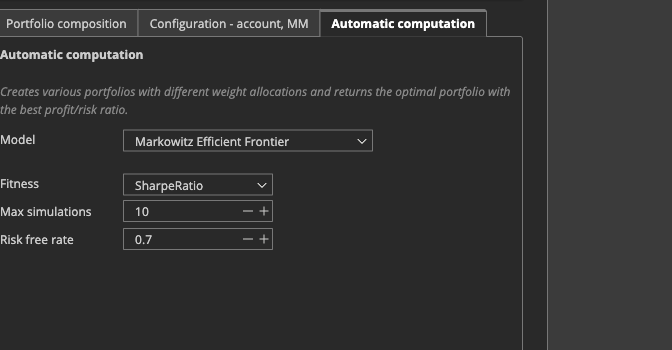
A concrete example of such a setting can be found in the Portfolio Composer. There's a field there called Simulations. It determines how many simulated weighting combinations are evaluated during the automatic calculation of a portfolio. The documentation gives example values such as 500 or 1000 for this.
These numbers are examples for this one Portfolio Composer function, not a universal rule for every strategy or portfolio. As with any Monte Carlo analysis, the same applies here: a higher number of simulations can make the estimate more reliable, but it requires more computing time.
Equity control simulation as another application
Besides the classic Monte Carlo analysis of a backtest, there's a related application used in practice: the equity control simulation. It switches a strategy on and off based on its equity curve, in order to compare different equity control models with each other and reduce risk.
In the free version of QuantAnalyzer, only a 30 percent share of trades is evaluated for this simulation. The method can reduce risk, but it doesn't eliminate a possible drawdown.
What a Monte Carlo simulation can't do
A Monte Carlo simulation works exclusively with variations of a strategy's already existing historical backtest data. Because it only repeats the existing backtest with small random changes, it doesn't bring any new, previously unseen market conditions or future price behavior into play.
That means: a good result from this estimate shows you how your strategy would have behaved under slightly altered variants of the past. It doesn't show you that the strategy will make money in live trading in the future, and it's also not a substitute for other checks such as a walk-forward analysis or an out-of-sample test. The Monte Carlo simulation is one building block among several that you can use to assess a strategy's stability against small changes, nothing more.
This article is for education only and is not investment advice. Past results, including backtests, do not guarantee future results. Trading financial instruments involves risk, and you can lose money.
This article is for education only and is not investment advice. Past results do not guarantee future results.
How do you do it? Share it in the community. Free, in your language.
Sign up free