In-Sample vs Out-of-Sample Trading: Why It Matters
You optimize a strategy in StrategyQuant X, the backtest runs green, the numbers look solid. And yet one question stays open: did the strategy find a rule that means something beyond this one curve, or did it just hug the past too closely? That question is exactly what the split between in-sample and out-of-sample data is for.
In this article you'll see what in-sample and out-of-sample data mean in StrategyQuant X, how to read the OOS/IS ratio in the Databank, and where the limits of this method lie.
Why part of the data has to stay untouched
A strategy comes together by testing and adjusting rules and parameters against historical price data. If you use the entire available history while doing that, you end up testing on the data the strategy already adapted to. The result almost always looks good, but it says little about whether the strategy found a real pattern or just traced the random noise of that one curve.
That's why the history gets split into two parts: one for building, and one for checking that stays out of the build process.
In-sample data: the workbench for your strategy
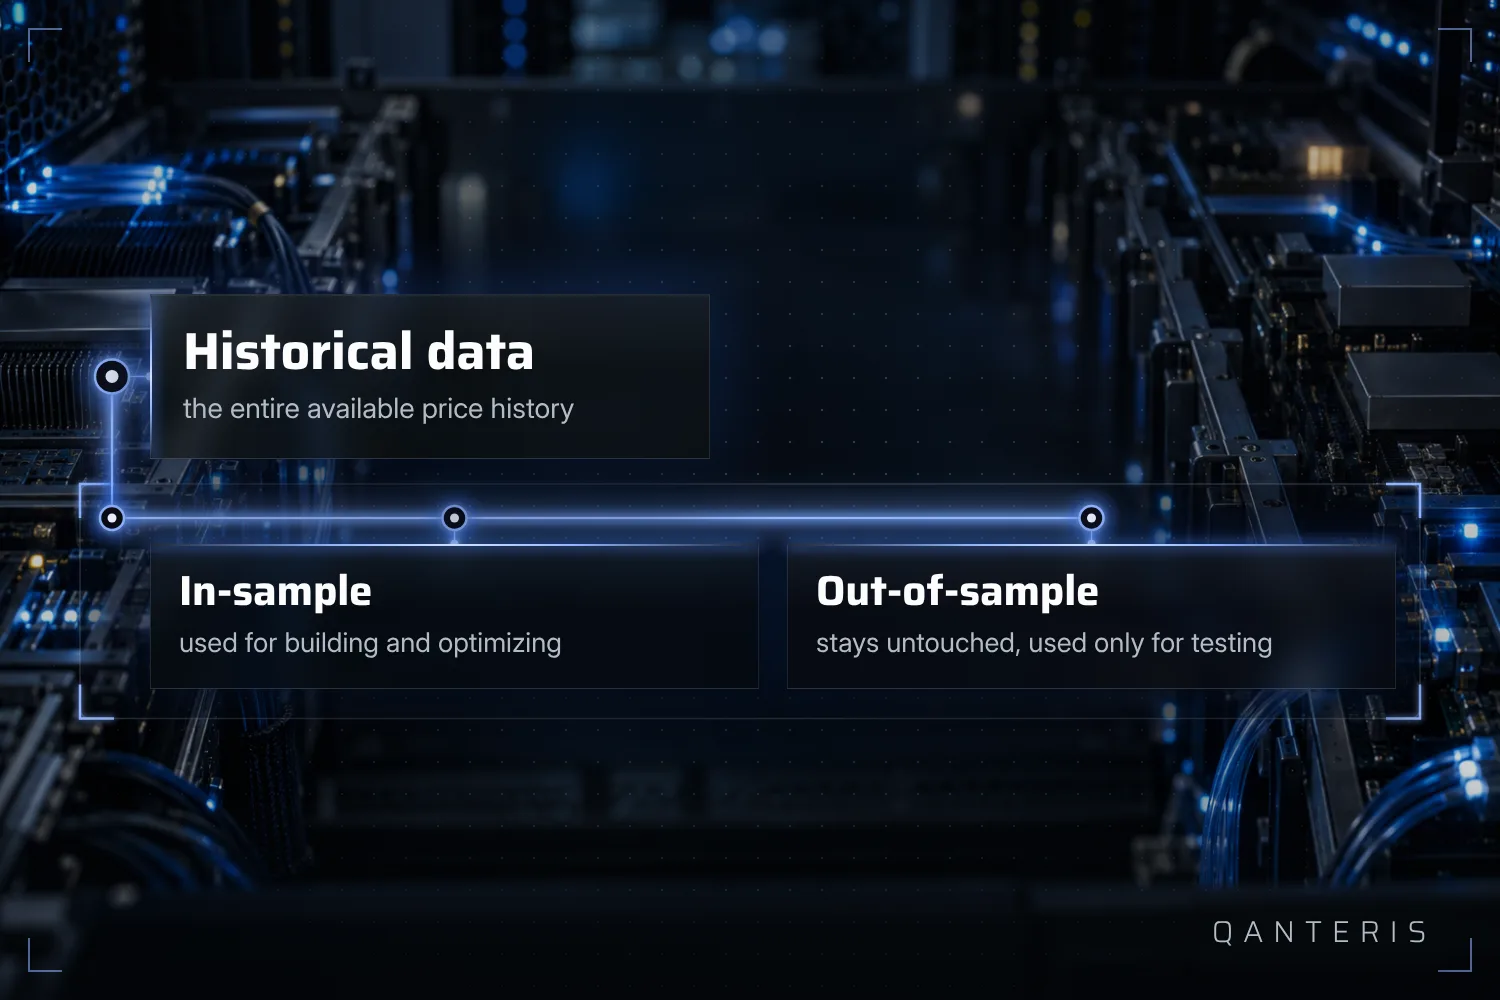
In-sample data, IS for short, is the part of the historical price data you use to develop and optimize a strategy. Parameters, rules and indicators get tuned on this data so that the best observed result shows up.
That's the normal flow when building a strategy in StrategyQuant X, and it's also necessary: without data to test ideas against, there's nothing to tune at all. What matters is what this number doesn't mean. A strong result on in-sample data says nothing about how the strategy will behave later in live trading. It only shows how well the rules adapted to that one stretch of the past.
Out-of-sample data: the untouched test
Out-of-sample data, OOS for short, is a separate part of the history that the strategy never sees during development. It's set aside purely for testing and validation and never feeds into the optimization. That keeps the check independent from whatever happened during the build.
For this split to be worth anything, one condition has to hold: the out-of-sample data has to stay untouched during optimization. The moment it flows back into the development process in any form, the split only exists on paper.
The IS/OOS split as a basic check against self-deception
The split into in-sample and out-of-sample counts as one of the basic robustness checks: a strategy built only on the data it's also measured against gives you no honest picture. Measure it as well on data it has never seen, and you get a picture closer to reality than judging it only on the data it adapted to.
The same condition applies here as in the definition itself: the check only works if the out-of-sample part stays out of the search for good parameters. And even when that holds, a passed out-of-sample test is a sign, not proof, that the strategy will work in live trading.
The OOS/IS ratio in the Databank
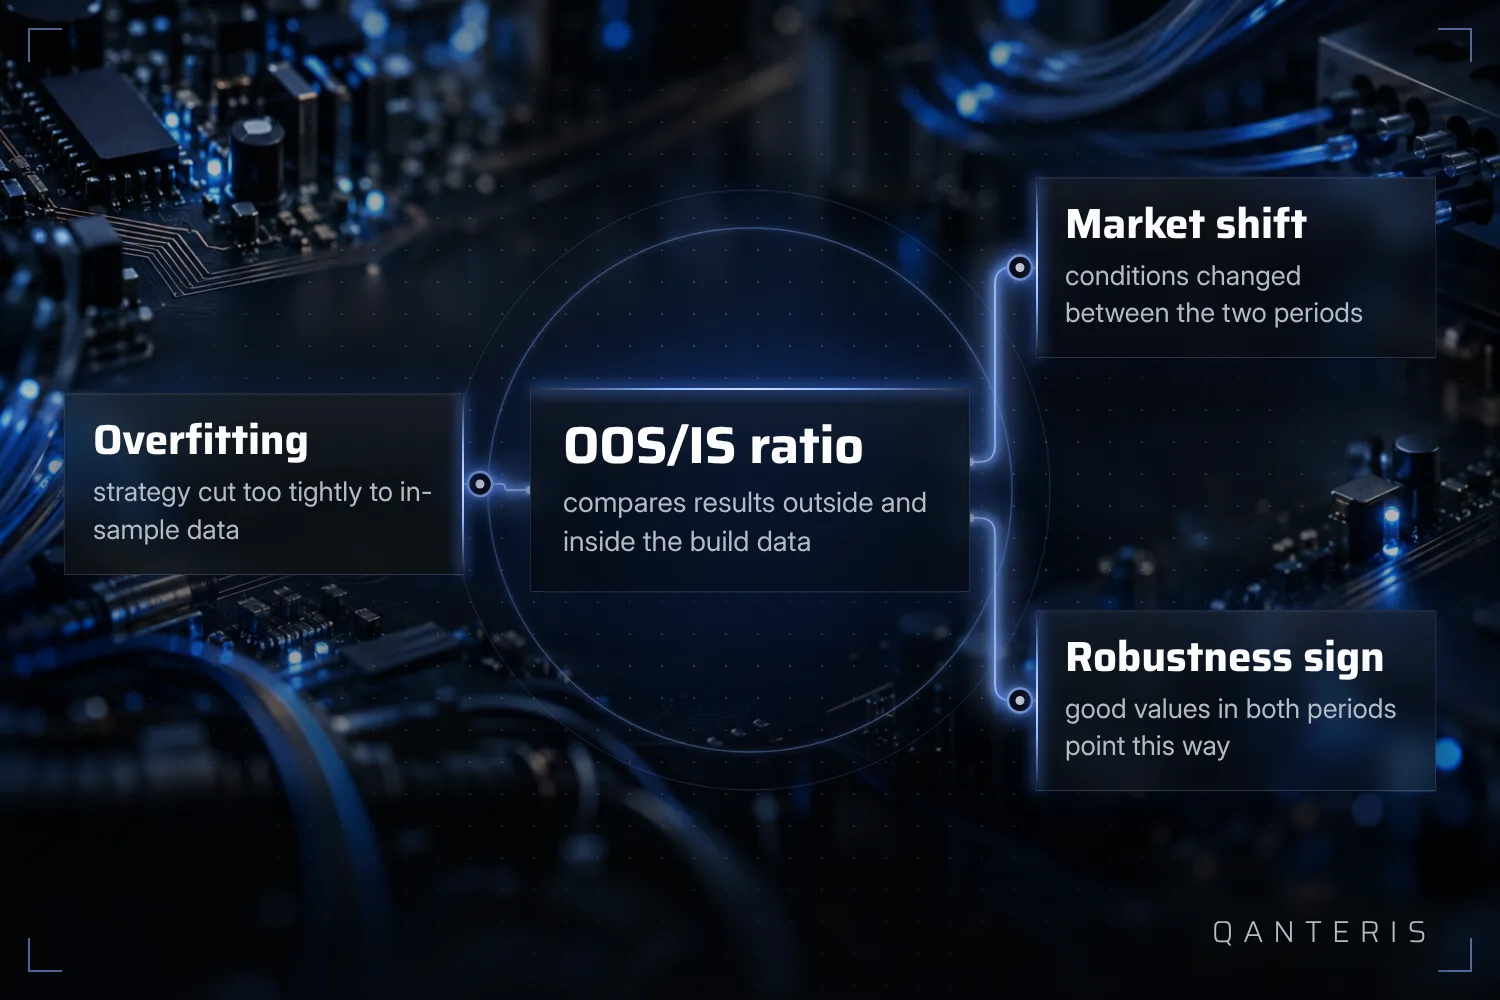
In the Databank of StrategyQuant X you'll find the OOS/IS ratio. This metric compares a strategy's performance values in the out-of-sample period with those in the in-sample period, and expresses how much the results degraded outside the data the strategy was built on.
The metric gets calculated in the Databank module after an optimization or walk-forward run has produced both in-sample and out-of-sample results. So it's not a value you simply read off, it's a result that only exists after a full run has produced both parts of the data.
What a bad ratio tells you, and what a good one doesn't prove
If performance drops noticeably from in-sample to out-of-sample, it shows up as a weak OOS/IS ratio. That usually points to one of two causes: the strategy was overfit to the in-sample data, cut too tightly to the details of that one curve, or market conditions shifted between the two periods. Good results in both periods, on the other hand, get read as a sign pointing toward robustness.
One limitation stays important here: this reading applies to exactly the instrument, timeframe and period split used for that one test. A good ratio doesn't prove the strategy is free of overfitting, and it doesn't reliably separate whether a weak ratio comes from the strategy or from the market environment. It's a clue you read alongside other checks, not a verdict on its own.
Visible in the Results tab: IS and OOS as colored bands
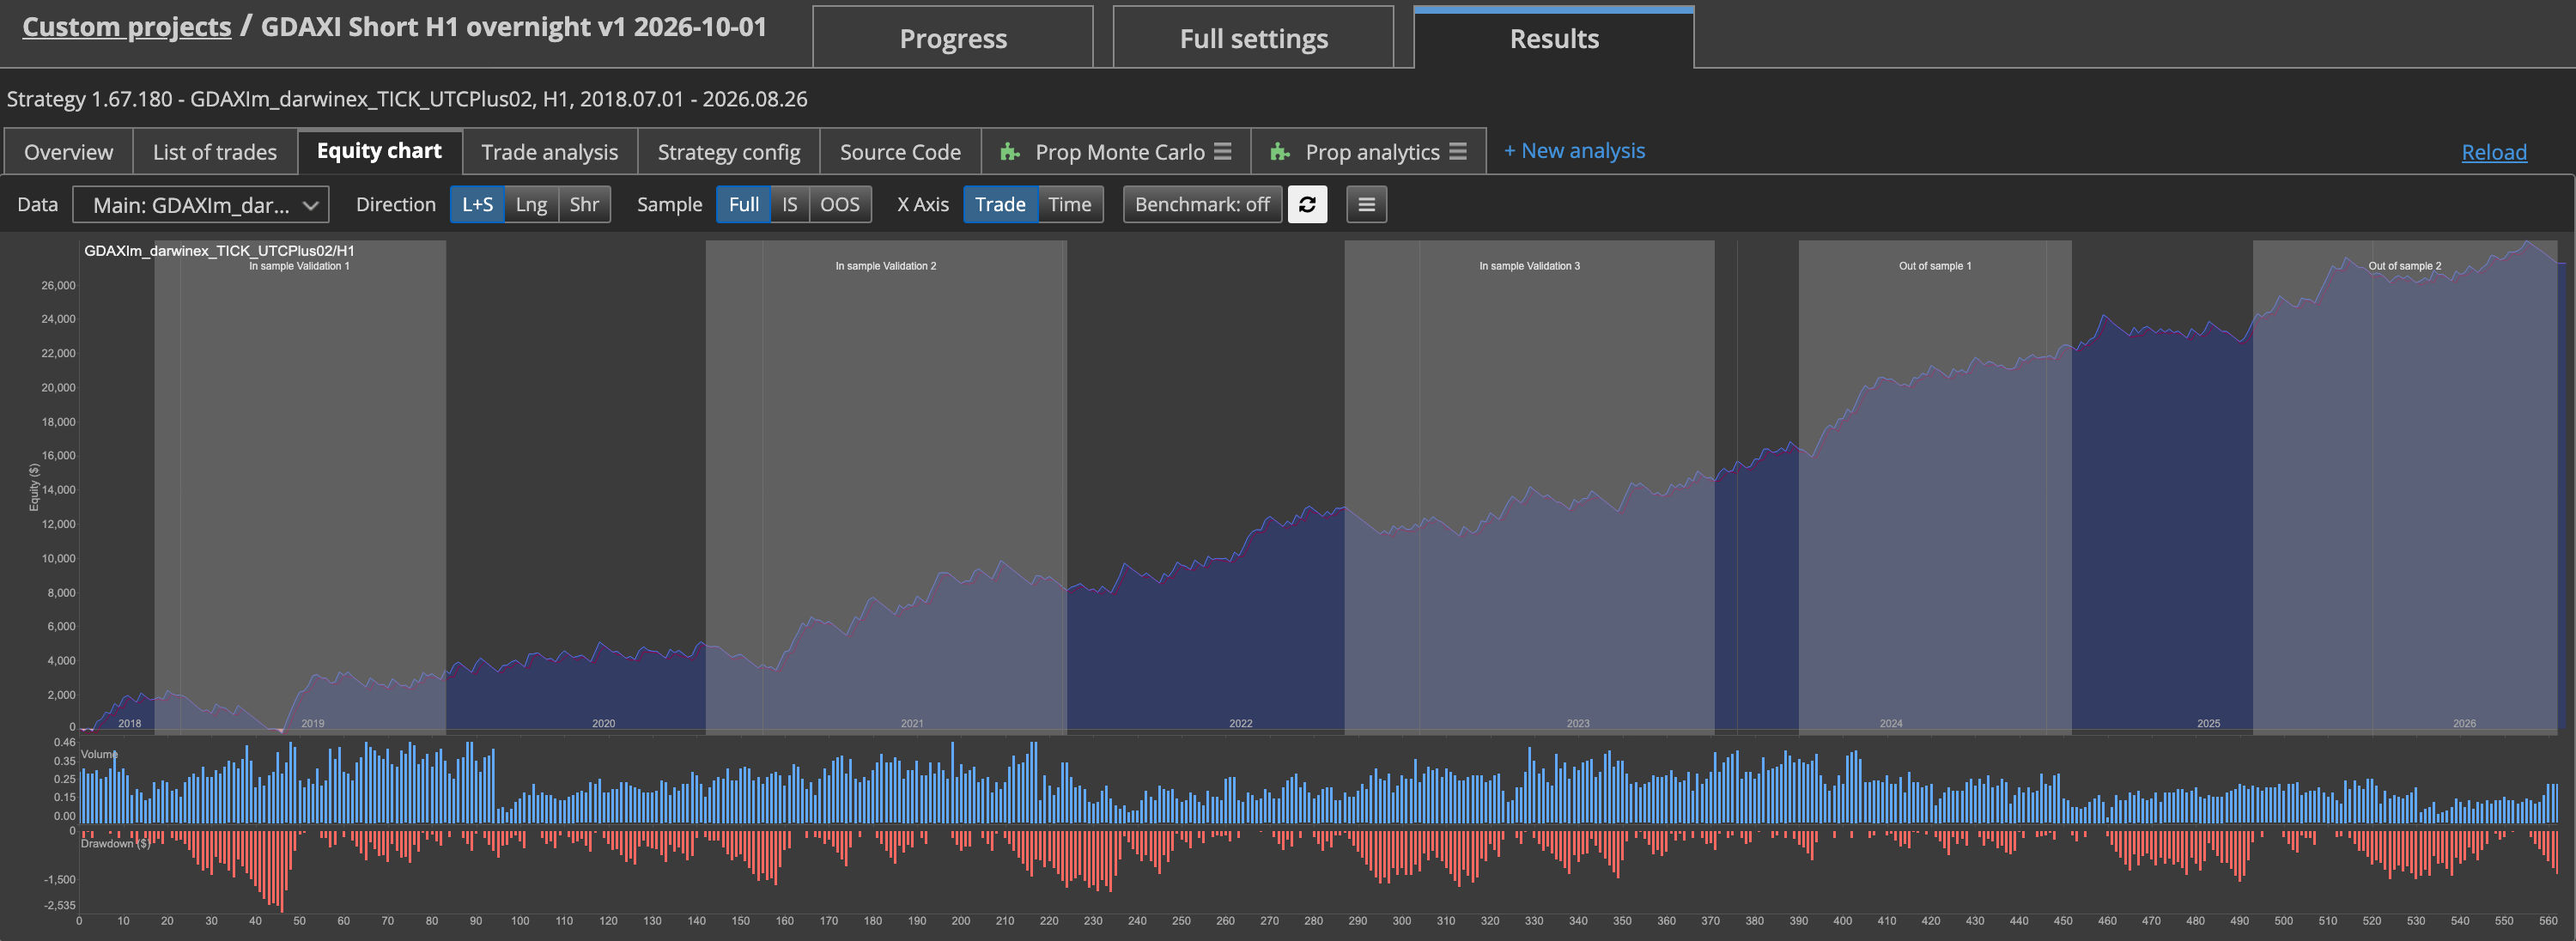
After a walk-forward run, individual trades in the Results tab get marked as in-sample or out-of-sample based on the walk-forward settings. The equity curve also shows the two periods as differently colored background bands, so the split is visible at a glance.
This coloring is a navigation aid, not a quality verdict. It shows you where in the timeline which phase sits, but on its own it says nothing about whether the strategy actually performed well in the out-of-sample phase. For that you still look at the metrics themselves, such as the OOS/IS ratio.
What this split doesn't tell you
A clean out-of-sample test on one historical data series is still a test on past data. It tells you how a strategy would have behaved in that one stretch of the past, with the parameters already fixed beforehand. It doesn't tell you how the same strategy behaves on market data that doesn't exist yet.
And the whole split only works as long as the out-of-sample part stays untouched. If you keep checking the same out-of-sample window during development and then adjust the strategy afterward, that knowledge seeps into the development step by step, even without entering the numbers directly into the optimization. The out-of-sample data then is not unknown anymore, and the check loses the exact value it was meant to provide.
That doesn't make the IS/OOS split useless. It remains a sensible basic check against the most obvious form of fooling yourself by optimizing past your own data. But it doesn't replace other checks, and it doesn't turn a good historical result into a promise for the future.
This article is for education only and is not investment advice. Past results, including backtests, do not guarantee future results. Trading financial instruments involves risk, and you can lose money.
This article is for education only and is not investment advice. Past results do not guarantee future results.
How do you do it? Share it in the community. Free, in your language.
Sign up free