Drawdown in Trading: What It Measures and What It Doesn't

If you open a backtest report in StrategyQuant X for the first time, you'll almost always run into a number that dominates the screen: the drawdown. Beginners are often unsure what this number actually describes, how StrategyQuant X calculates it, and what it does and doesn't tell you about a trading strategy. This article clears that up. You'll learn what drawdown measures, how it shows up as Max DD % in your results, how it relates to position size, and where the limits of this metric lie.
What drawdown measures: the drop from a previous high
In StrategyQuant X, drawdown refers to the drop of the running, cumulative profit curve, that is, the equity curve, from its previous historical peak. If the account reaches a new high in a backtest and then falls back, the difference between that high and the current level is the drawdown at that point in time. This is how StrategyQuant X uses the term in backtests and in result reports.
Max DD %: the largest drop measured in the test
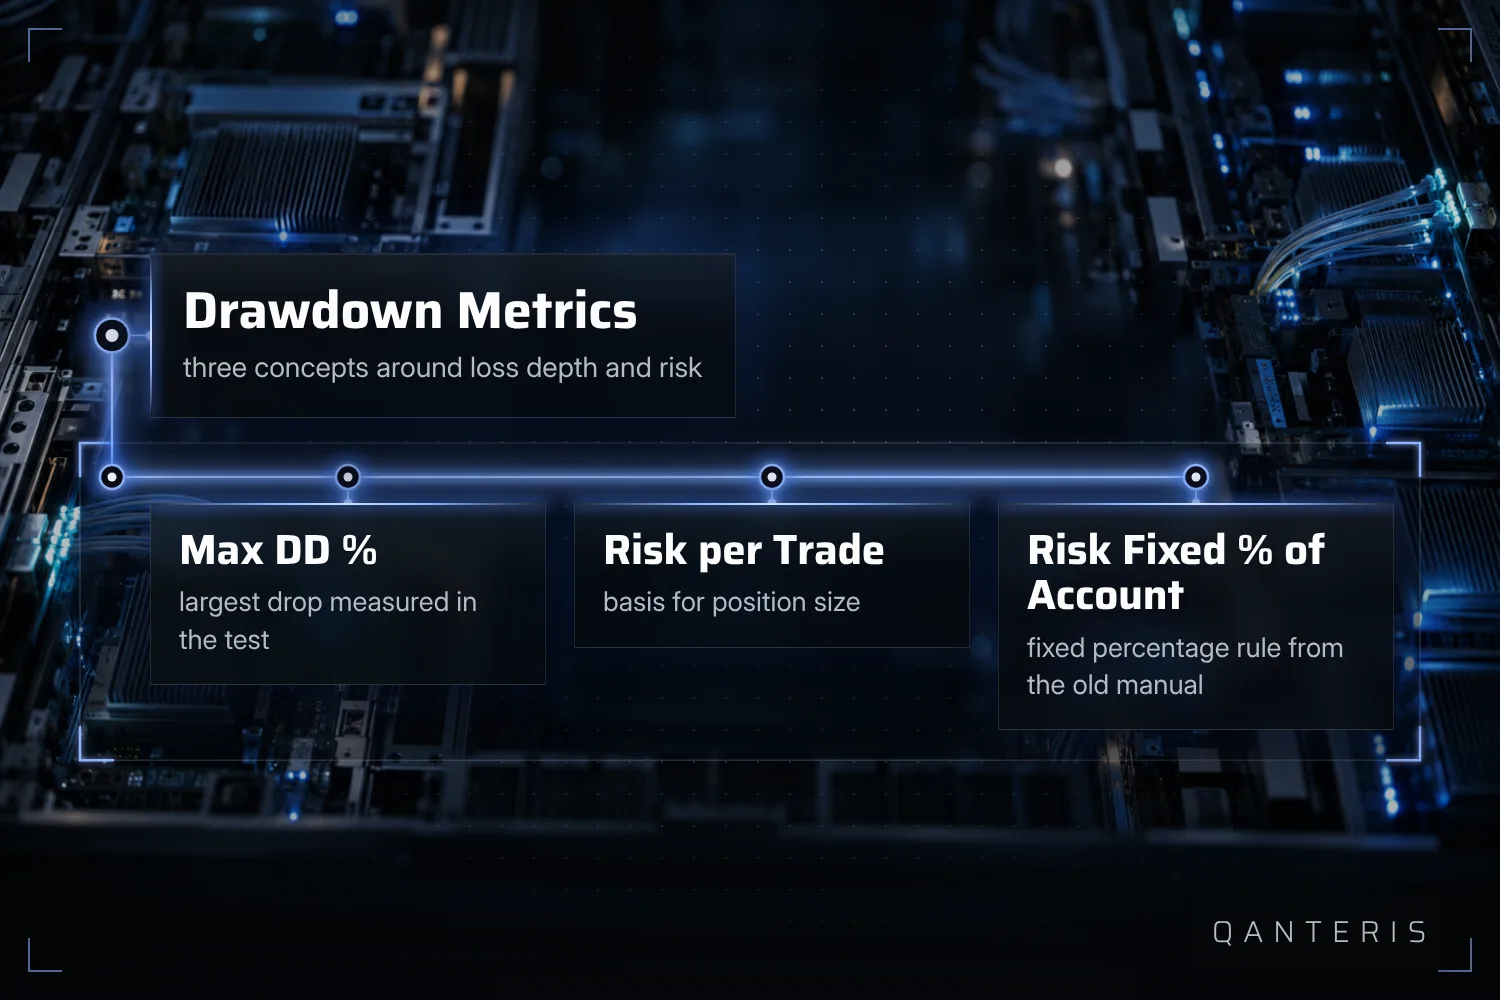
Alongside the running drawdown, StrategyQuant X shows a summary metric: Max DD %, sometimes also labeled % Draw Down. It shows the largest percentage drop in capital or equity that occurred over the entire tested period. Here's what matters: this value always refers to a specific, already-completed historical test period. It describes what happened in that exact data, not what will happen in the future.
Risk per trade: the basis for position size
Drawdown considerations are closely tied to position size, and that's where the term risk per trade comes in. It refers to how much a single position risks, and money management methods like "Risk fixed % of account" use exactly this value to calculate position size. Risk per trade is usually derived from the stop loss, or, if no stop loss is set, from the maximum or average loss.
Risk fixed % of account: an older rule of thumb from the manual
The money management method "Risk fixed % of account" lets you set what percentage of your account balance you risk per trade. Older StrategyQuant manual material, valid up through version 3.6.1, describes this method as a recommendation for live trading and mentions a suggested range of roughly 2 to 5 percent per trade. That's a documented suggestion from this older material. It's not a rule the software enforces, and it's not a claim that this exact range is right or safe for your trading.
What a drawdown number shows and what it doesn't
Max DD % and other drawdown values in StrategyQuant X describe only what occurred in a specific historical backtest, optimization, or simulation. These values are a look back at past data. They don't determine and don't predict how large a drawdown will turn out to be in later live trading of the same strategy. So use a drawdown number to understand how a strategy behaved in the past, not as a promise of what's to come.
This article is for education only and is not investment advice. Past results, including backtests, do not guarantee future results. Trading financial instruments involves risk, and you can lose money.
This article is for education only and is not investment advice. Past results do not guarantee future results.
How do you do it? Share it in the community. Free, in your language.
Sign up free